Spaced repetition for skills, not just facts.
Write code that runs, solve math problems that change every time, and type your answers instead of flipping cards. Each one comes back right before you’d forget it.
No signup required · Already have an account? Sign in
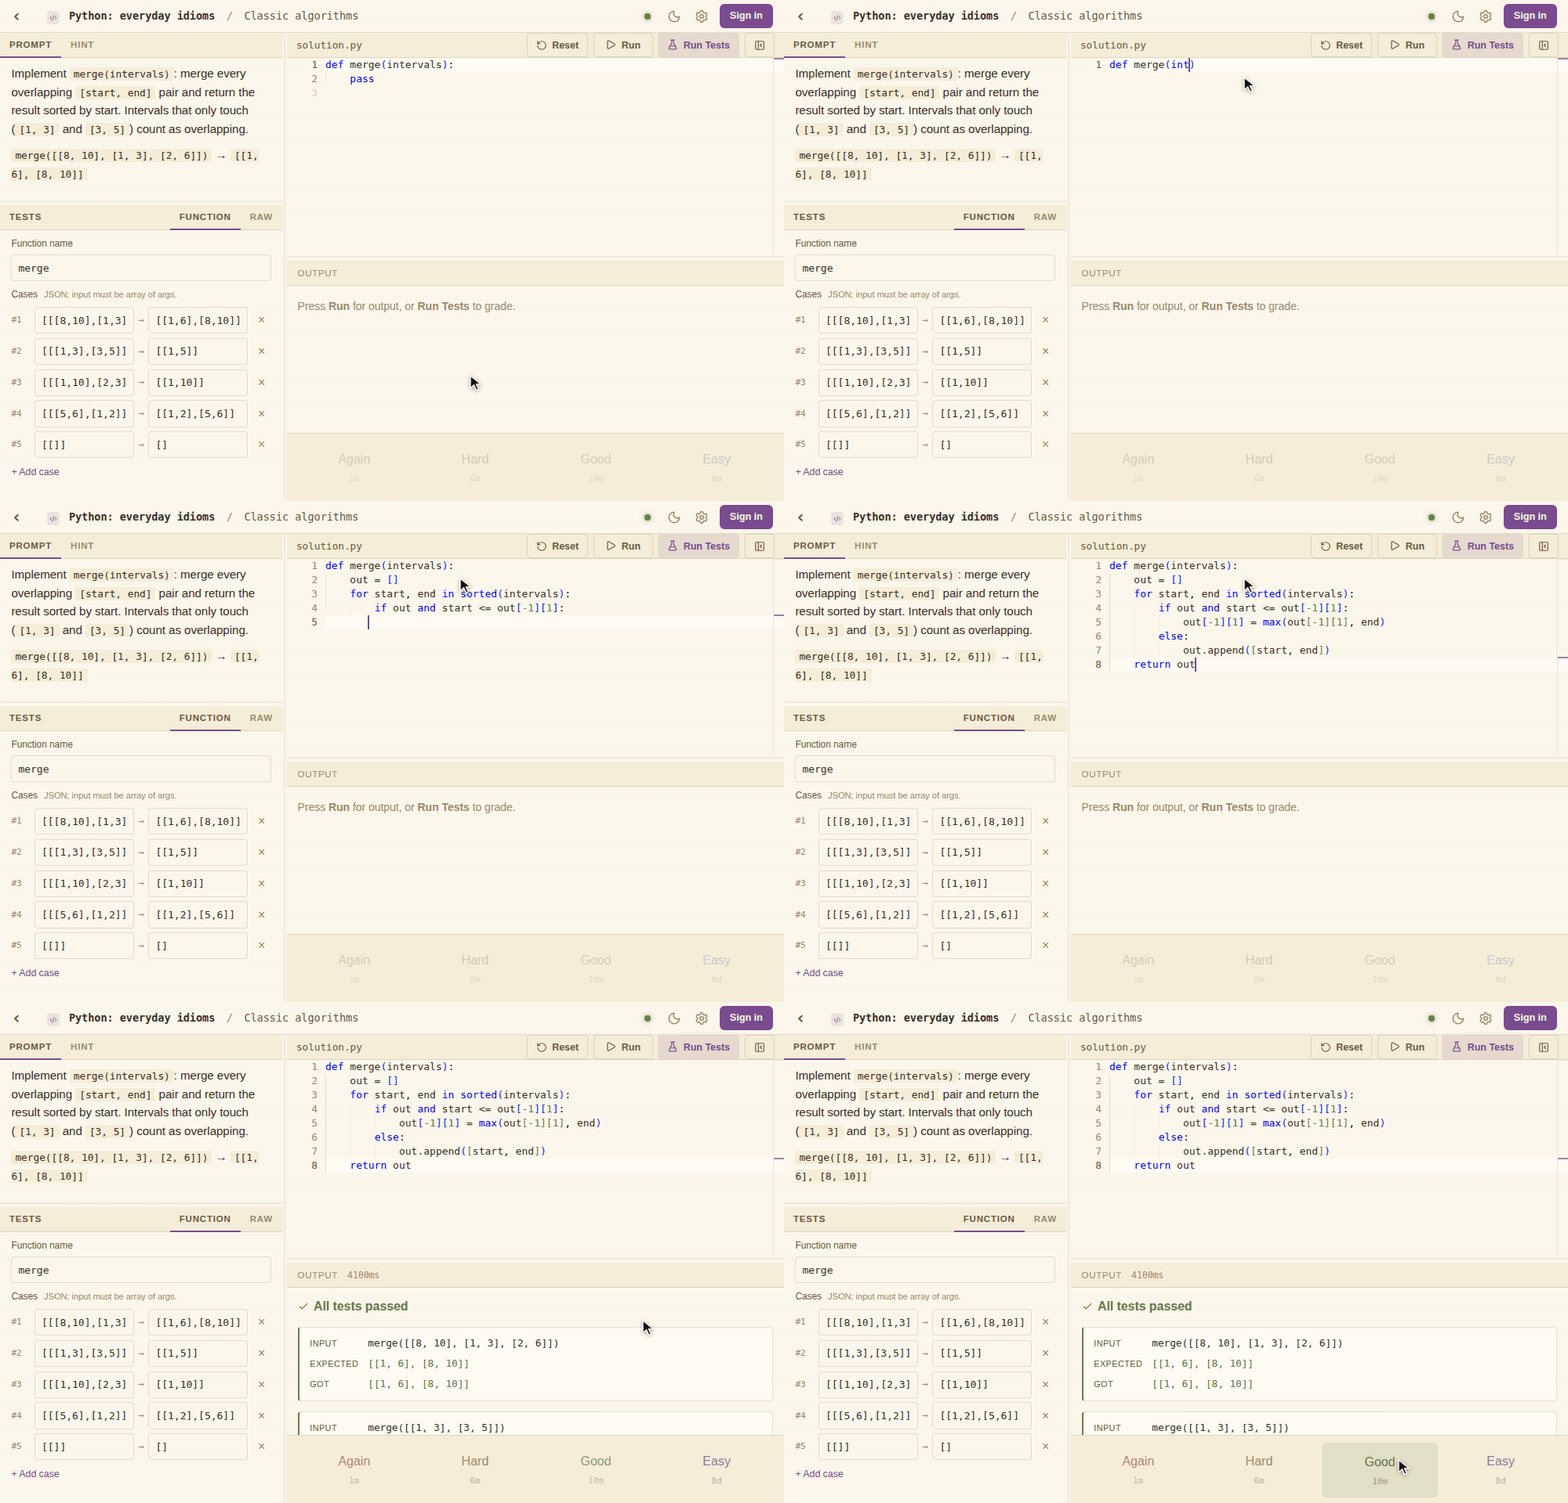
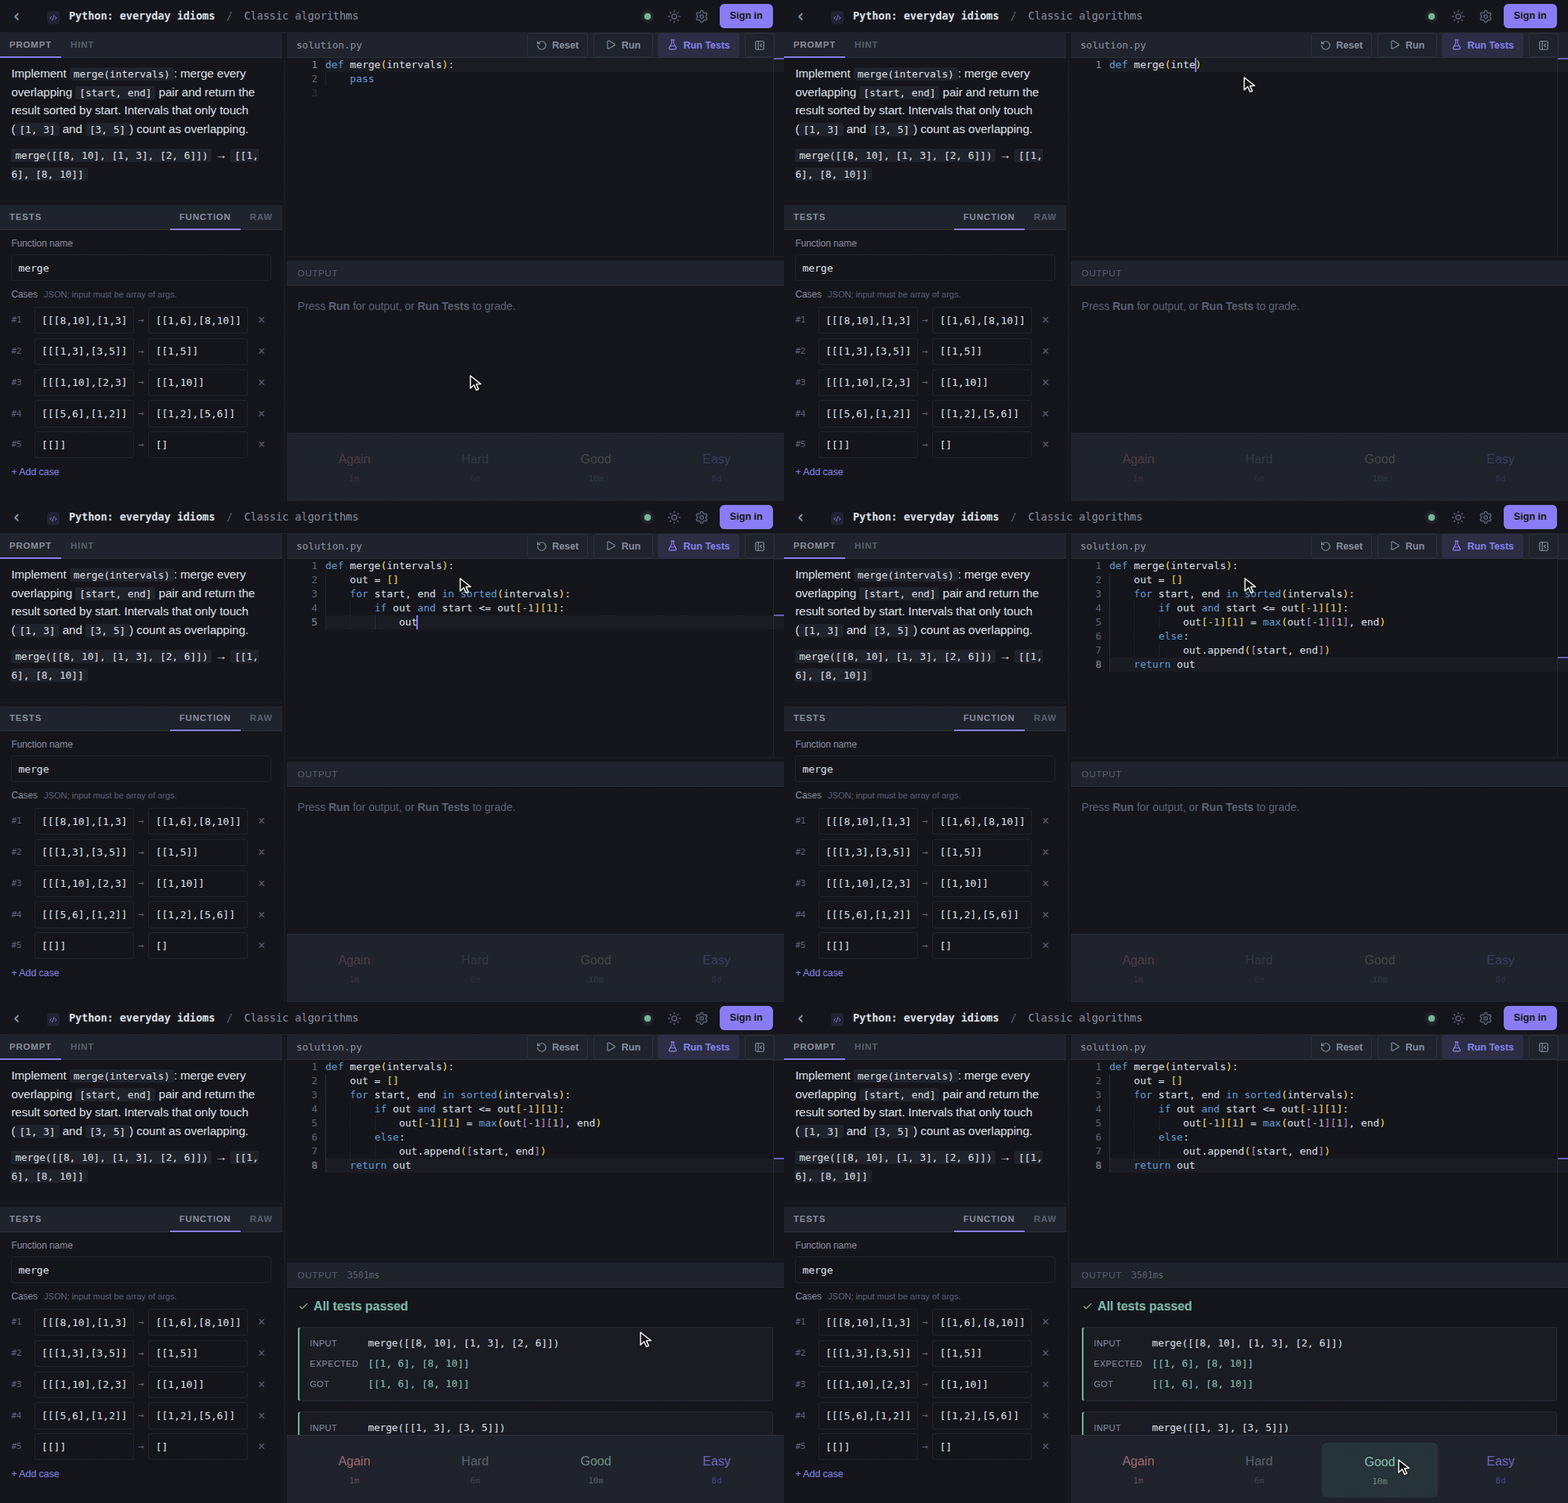
Write a real solution and run it against the card’s tests, right in your browser. It passes or it doesn’t, so there’s no guessing whether you knew it.
- Python
- JavaScript
- TypeScript
- SQL
- Rust
- Go
- C
- C#
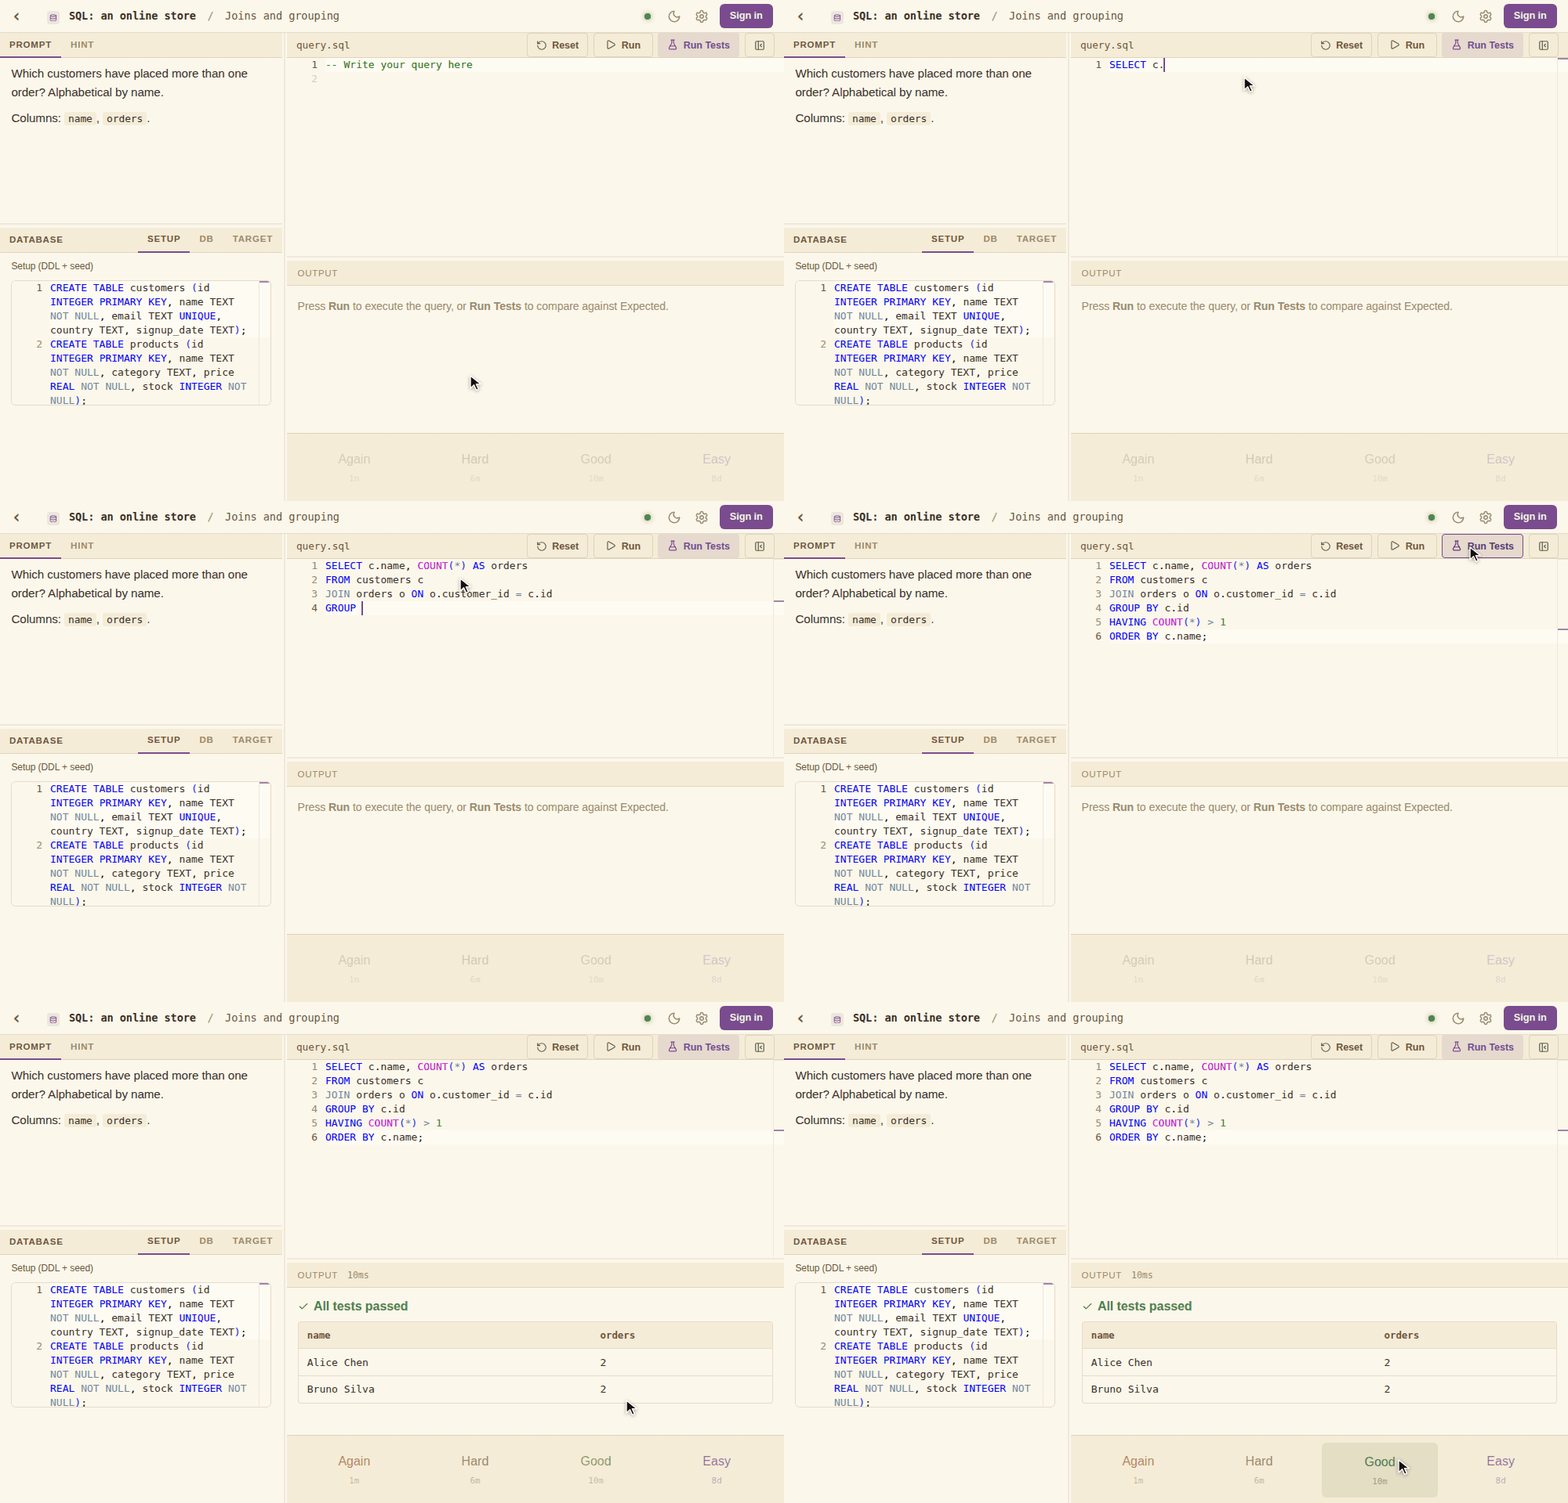
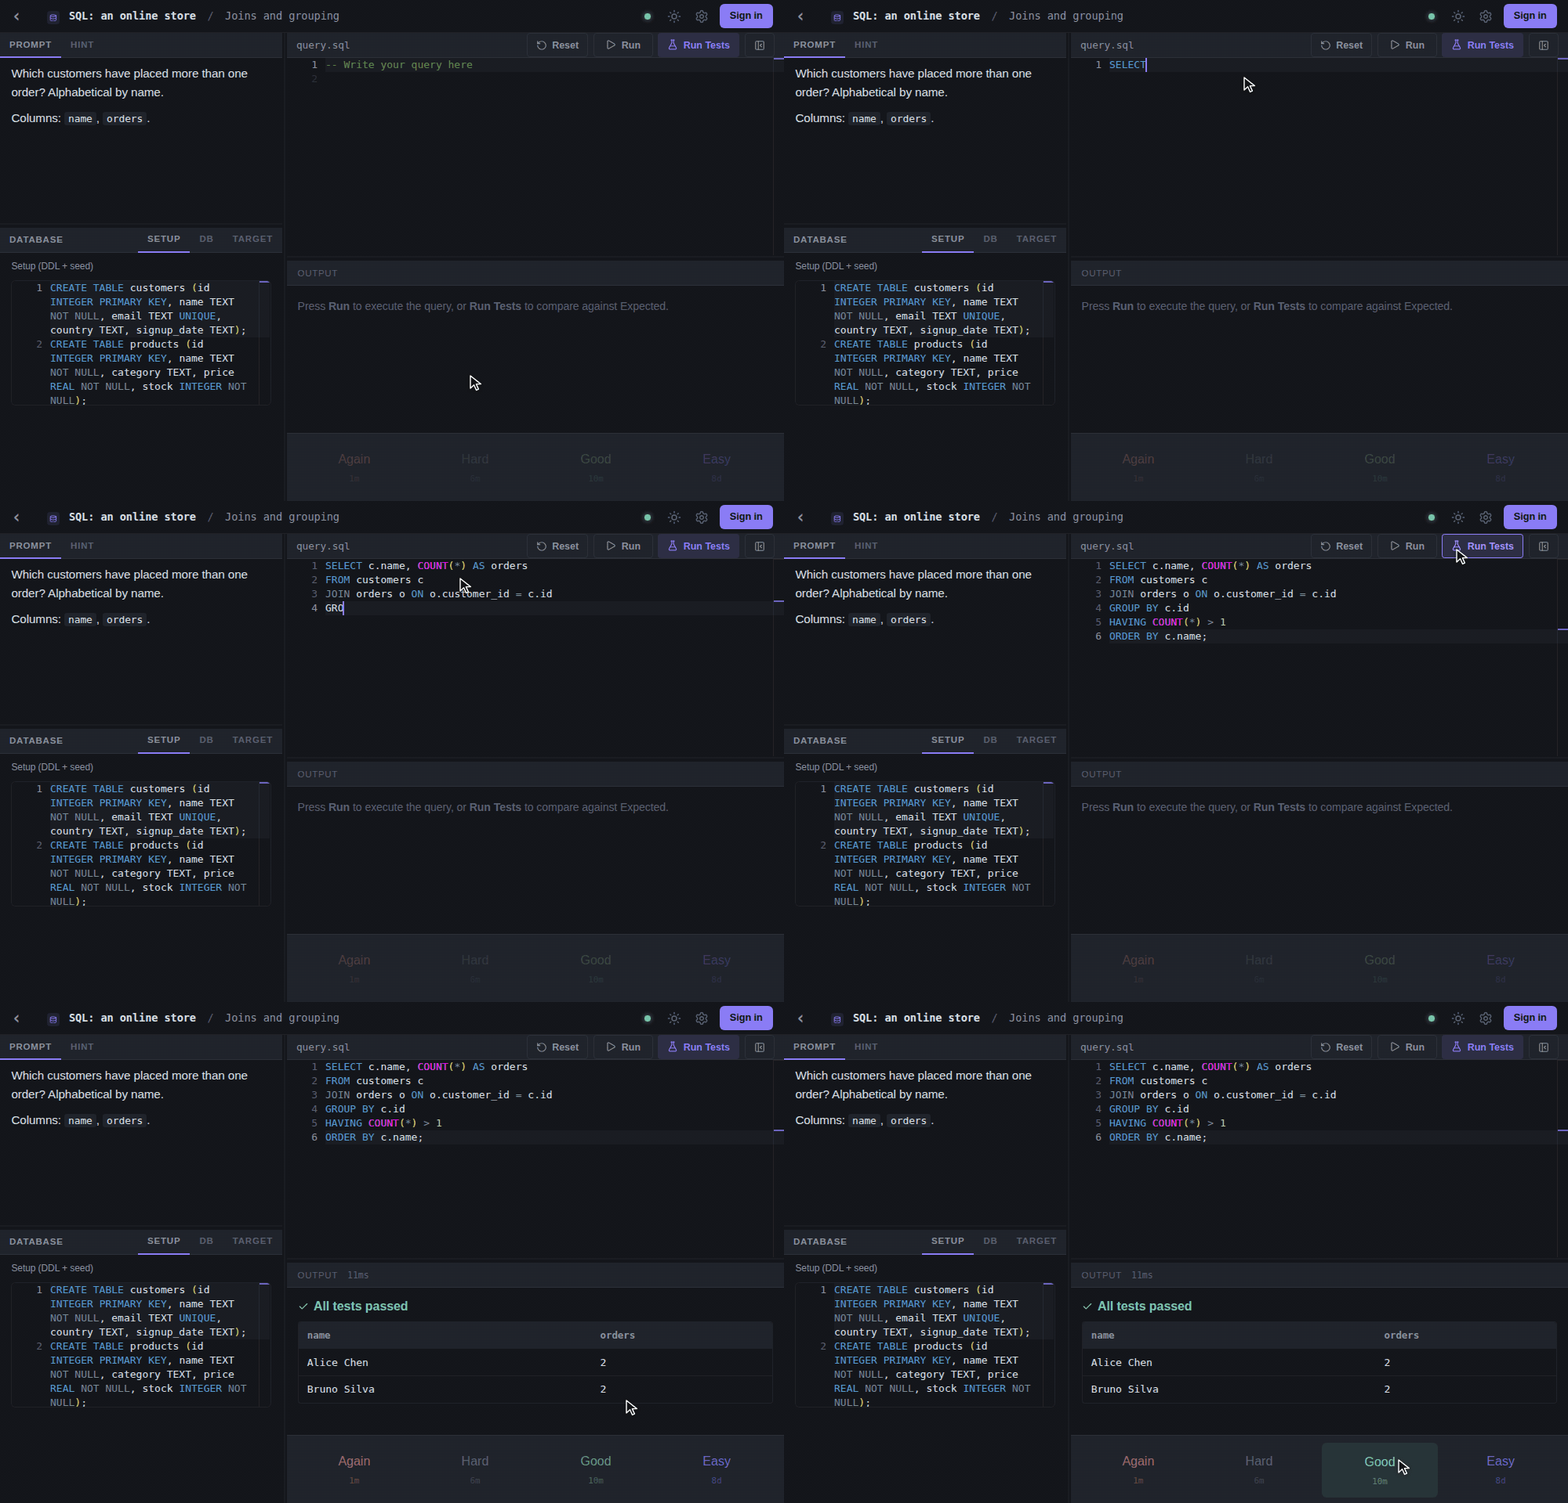
Query a real database in your browser. Your rows are checked against the expected result.
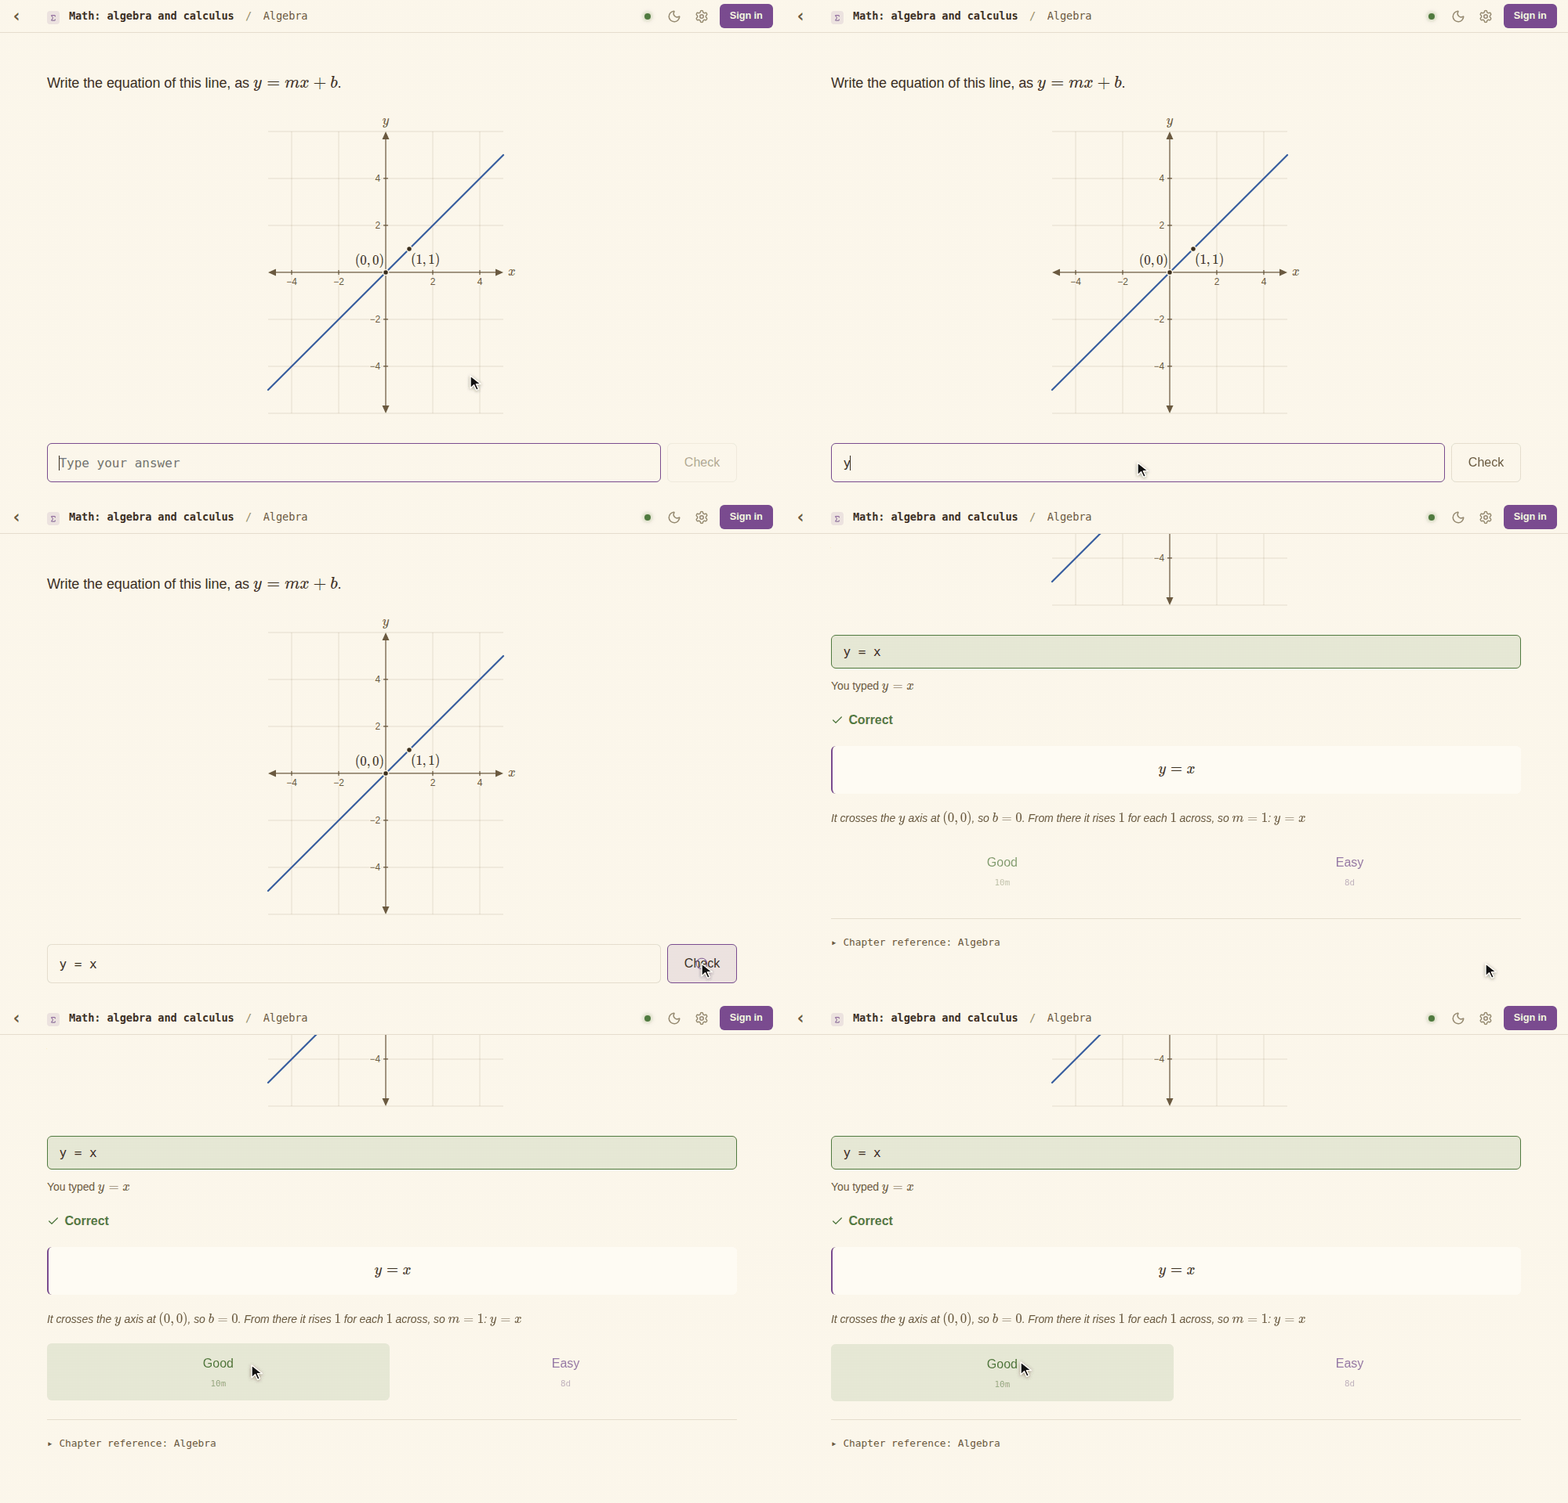
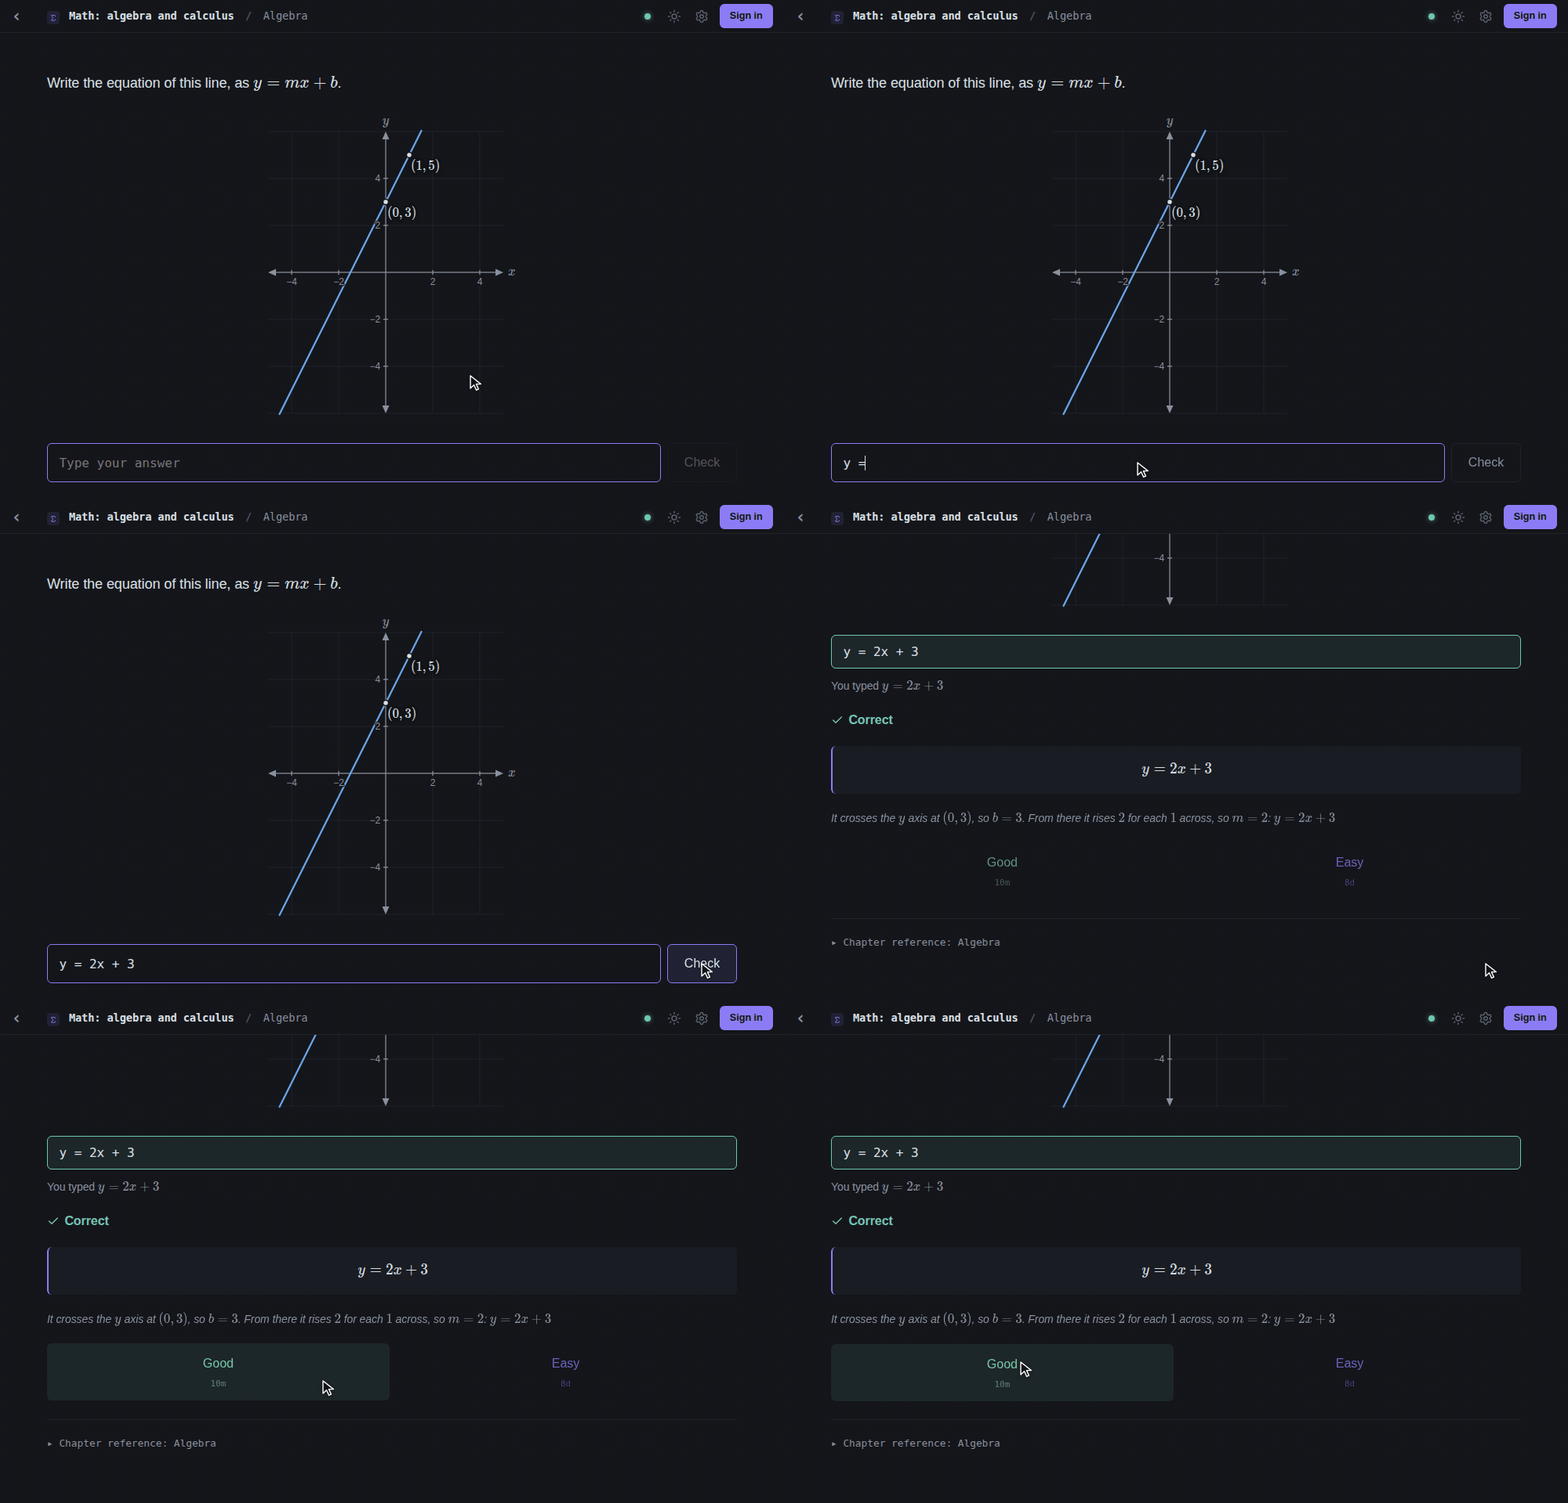
Dynamic cards make new numbers, and a new drawing, every time they come back. You can’t memorize the answer, so you end up remembering the method. Once you’ve answered, you see it worked out.
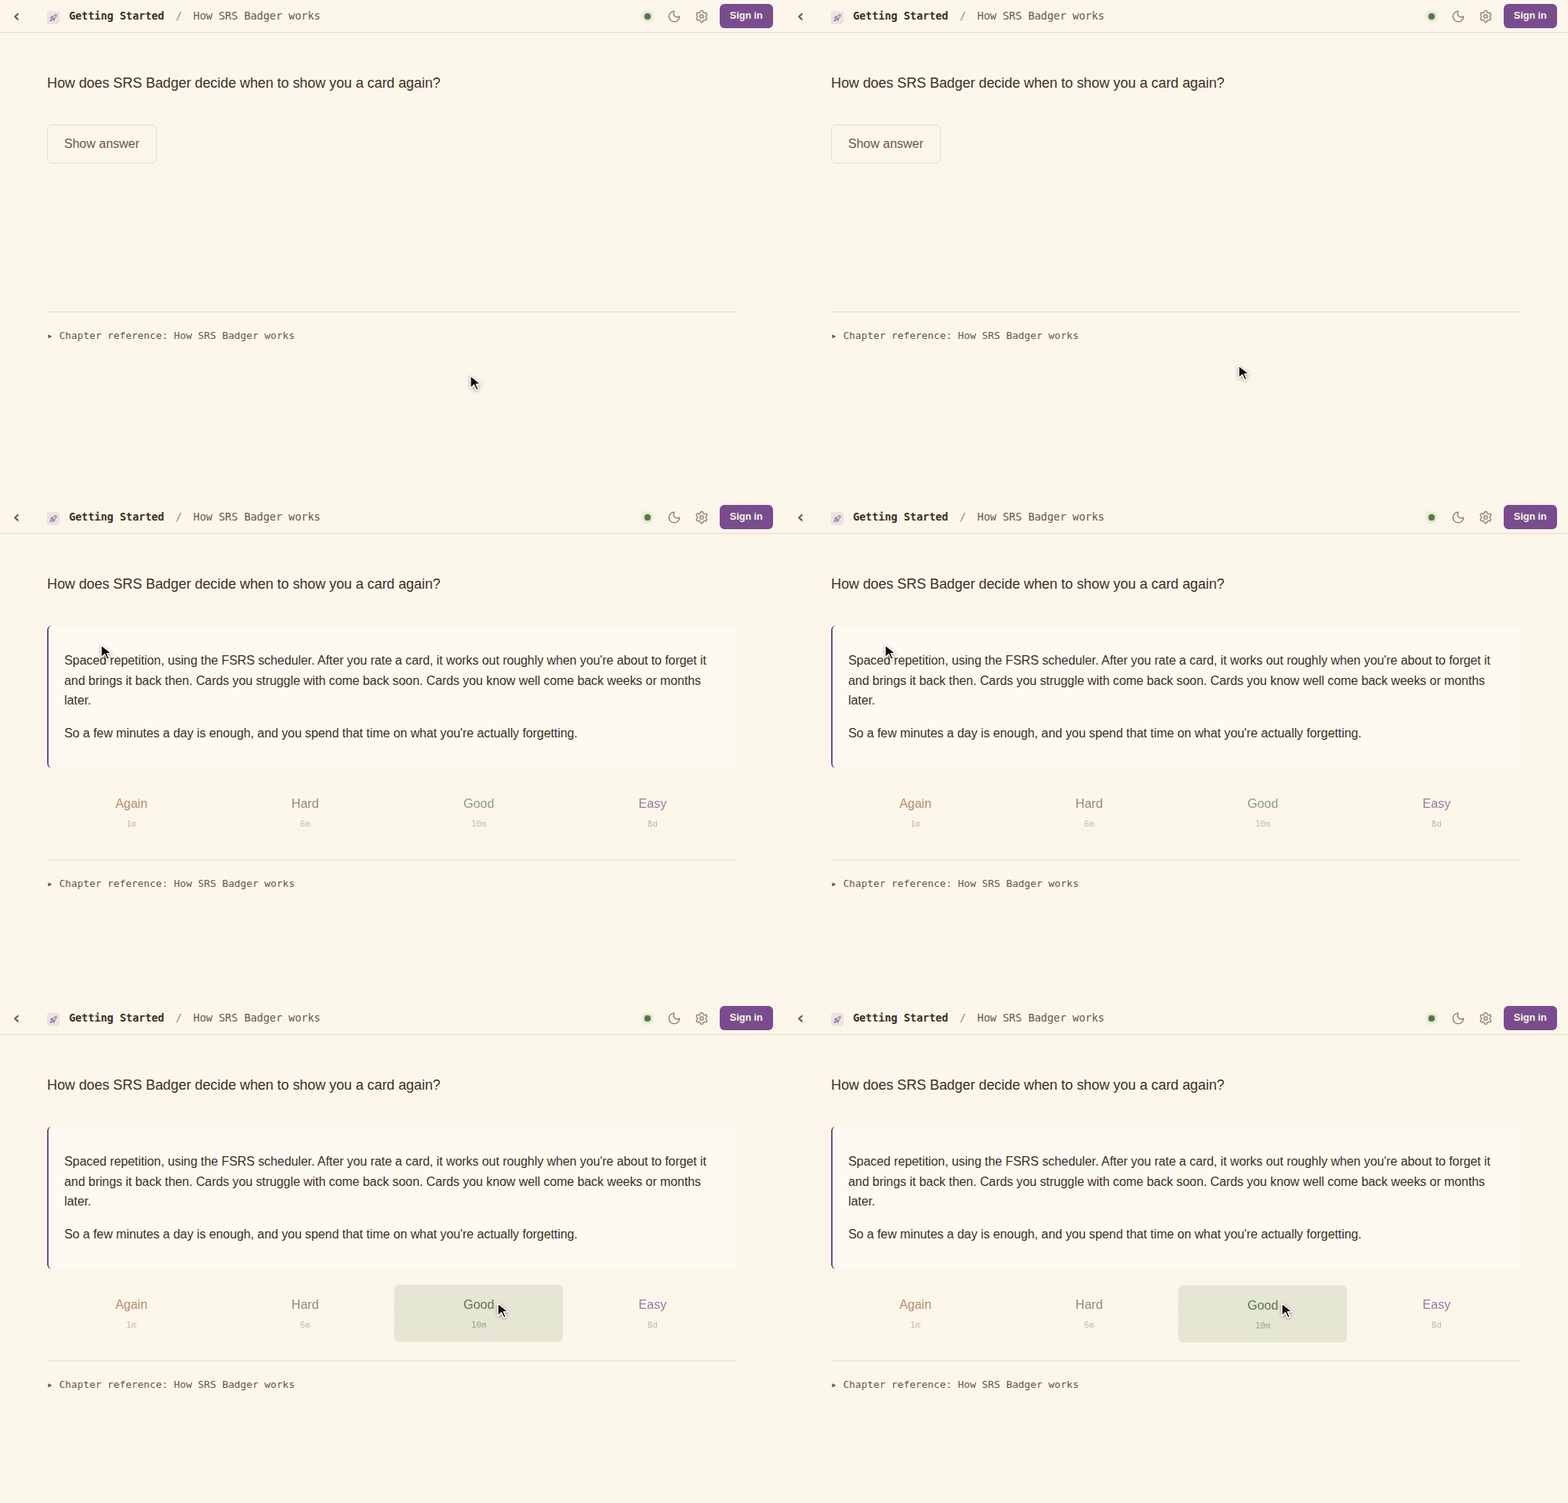
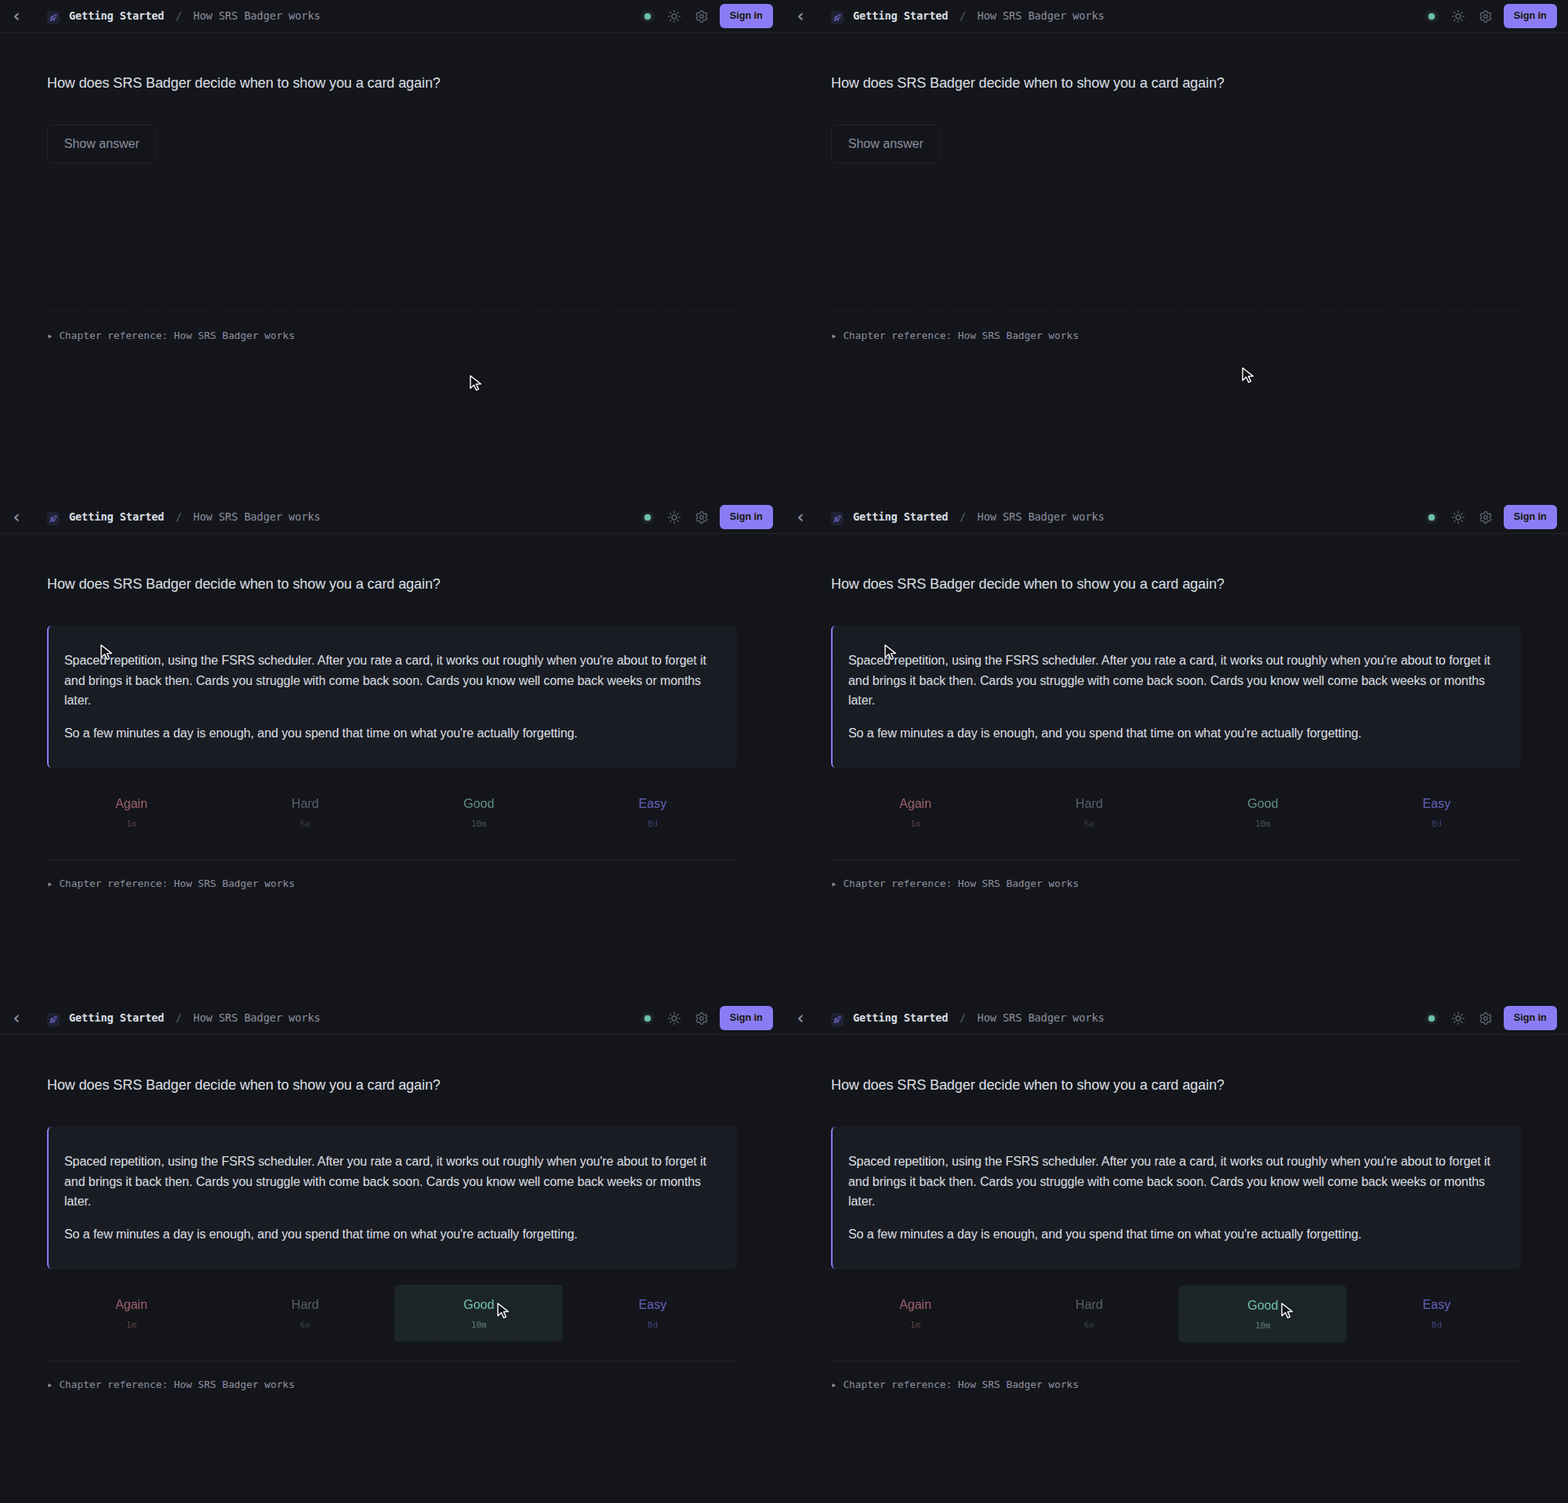
Plain flashcards, typed answers and multiple choice, for the facts, rules and definitions you need to have ready.
Cards can draw
Graphs, arrays, plots, charts and Venn diagrams, written as a few lines of text right in the card. On a dynamic card the drawing changes with the numbers, so the picture always matches the problem.
Graphs and trees Arrays and grids Functions and areas Charts and plots Venn diagrams
In color
Highlight or color any node or edge, even one of several between the same two nodes: a coloring, a walk, the parts of a graph.
Colorings Euler’s bridges Strong components
Want one without writing it out? Make it by clicking, the same way the card editor does.
Coaching a team or a class?
Share a course with a class link. Your students practice on their own schedule, and you can see who’s keeping up and which questions they keep missing, card by card, so you know what to go over next time you meet.
Students are told exactly what you’ll see before they join, and you only see their progress on that one course. If a student leaves your class, they keep the course and everything they’ve learned; you just stop seeing their progress.
Write your own cards
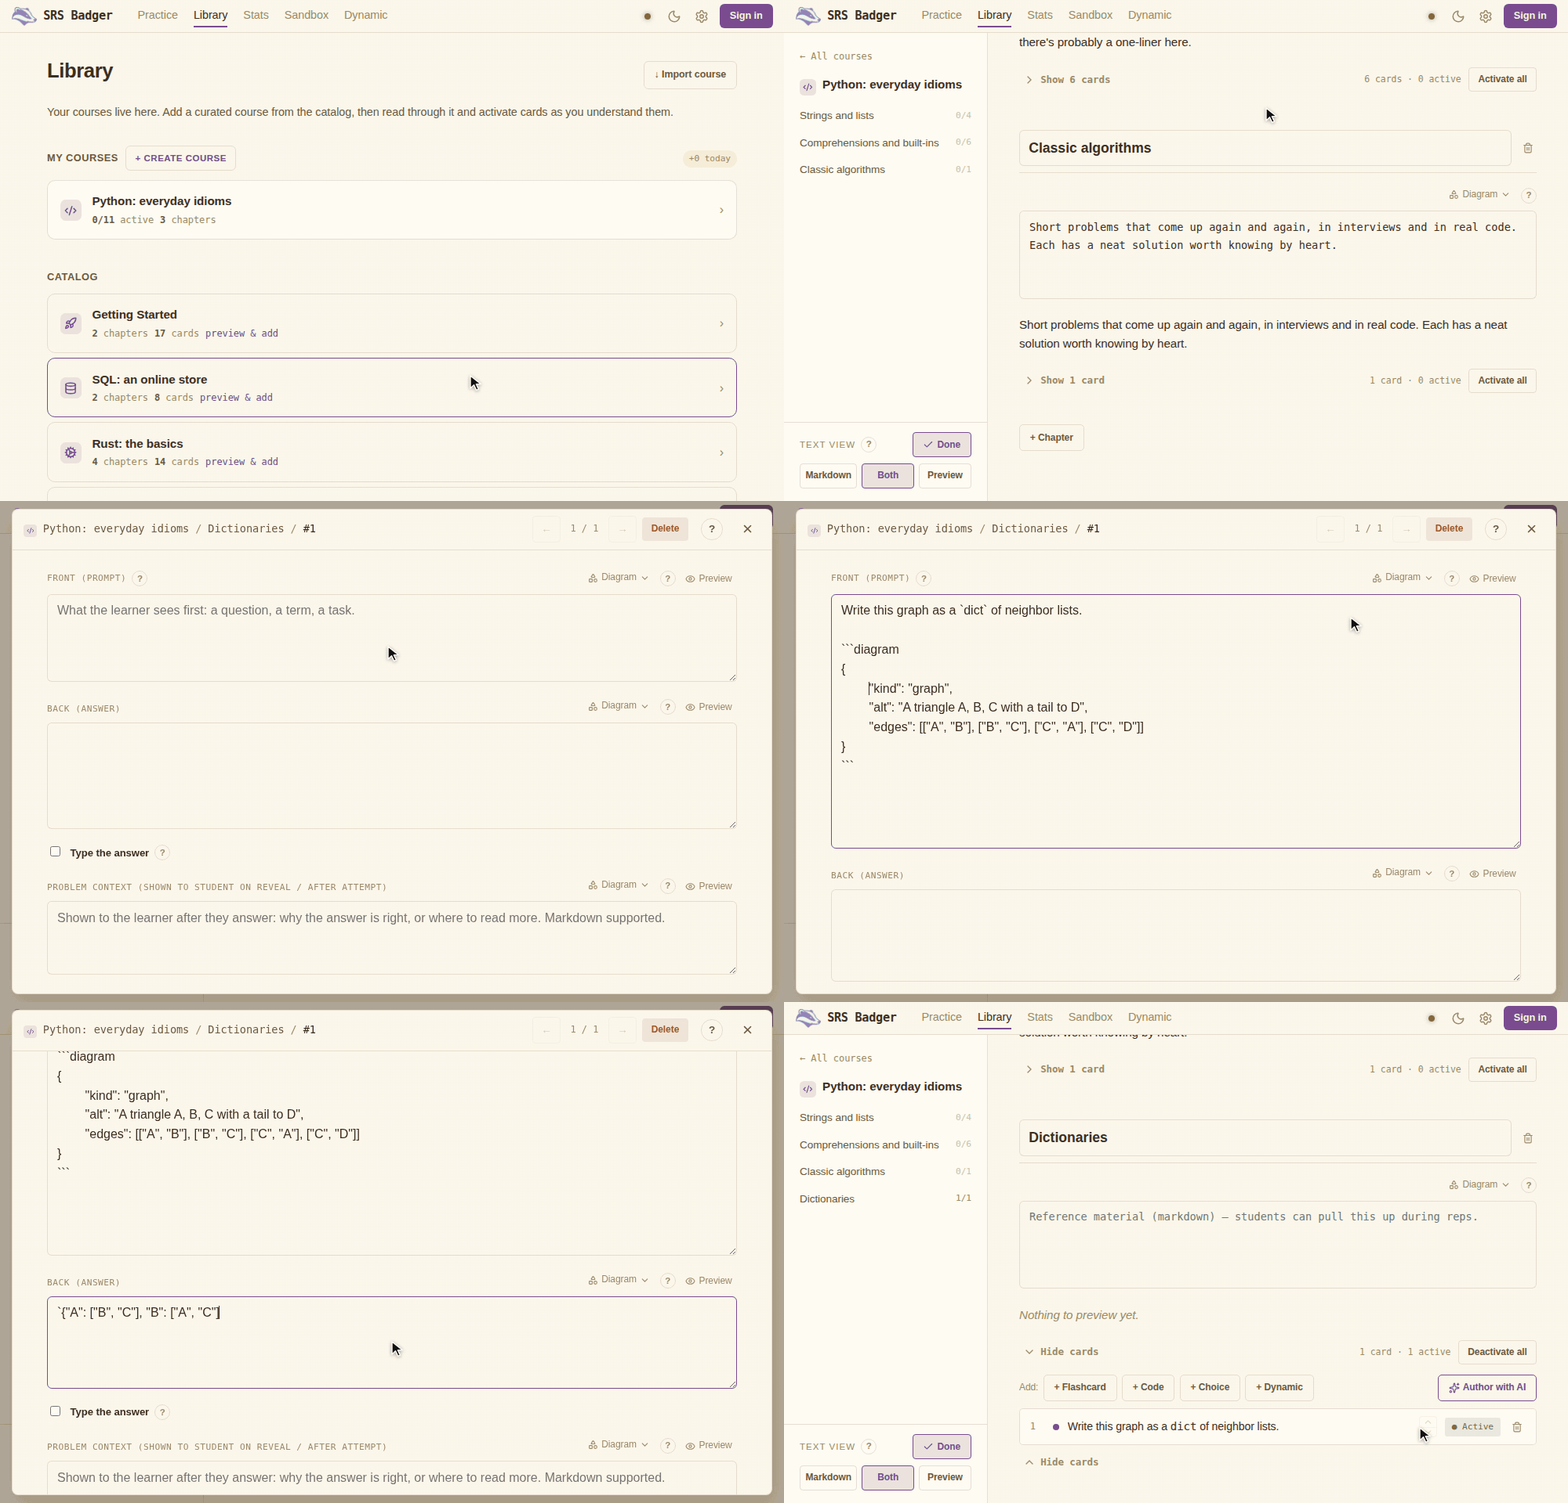
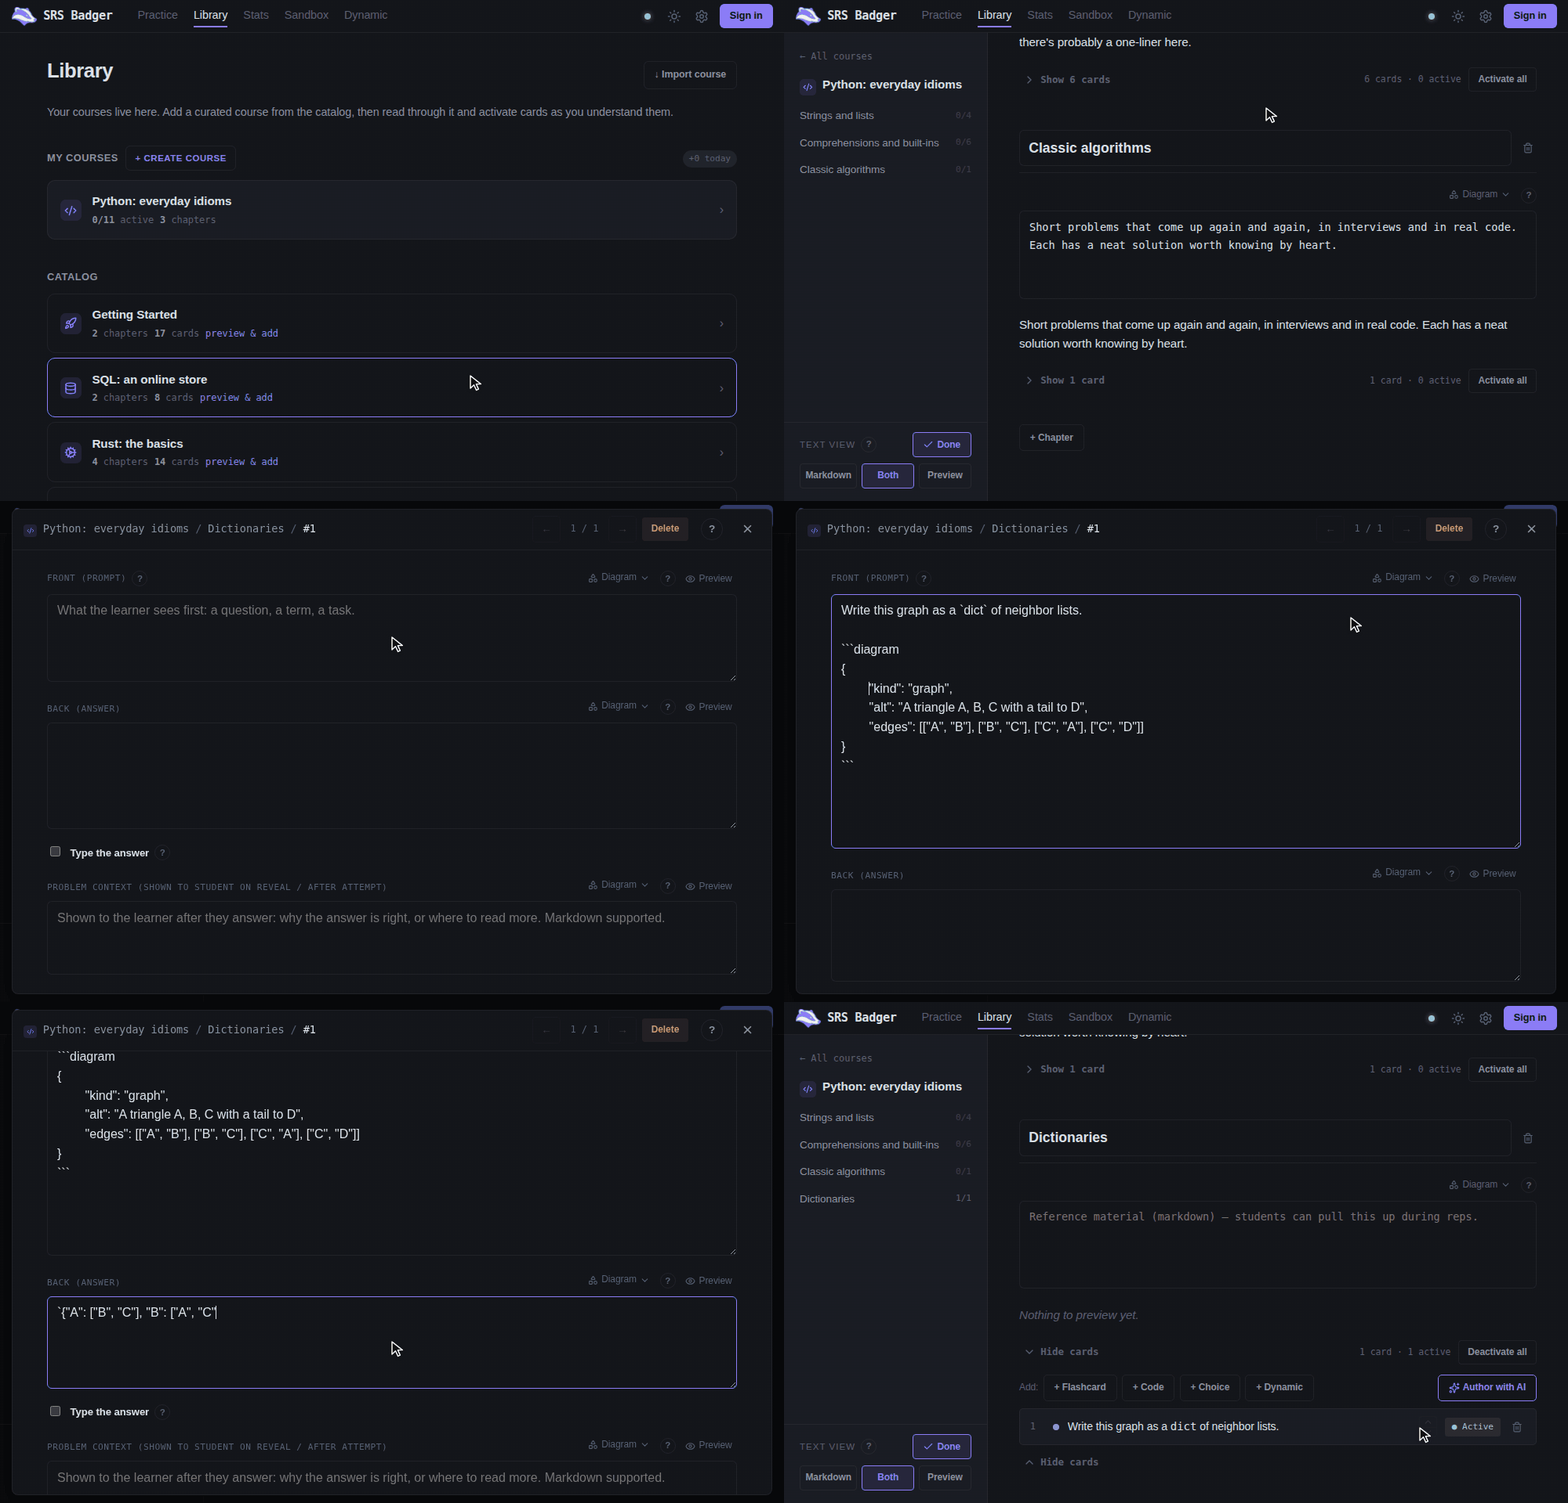
Add a chapter to any of your courses and write cards for the things you keep looking up. Markdown, math and diagrams work everywhere, with a live preview as you type.
Code and dynamic cards come with templates to start from. Or ask the AI chat you already use: copy a prompt, paste back what it writes, and every field is filled in for you to check.